


How does Quantitative trading work?
How to create a Quantitative trading system
Quantitative trading strategies
Algorithmic Pattern Recognition
Pros and cons of Quant trading
Quantitative trading, often referred to as 'quant trading,' is a sophisticated trading strategy that leverages mathematical and statistical models to identify and execute trading opportunities in financial markets. This approach, akin to having a supercomputer as your trading partner, contrasts sharply with traditional trading methods that rely on human intuition and qualitative analysis. Here is a comprehensive guide to Quantitative trading and how to use it effectively in Forex.
What is Quantitative trading?
Quantitative or Quant trading is a strategy based on statistical data analysis. Traders harness the power of mathematical models to analyse vast amounts of data and uncover trading opportunities that might elude the human eye. This efficiency is a key advantage of Quantitative trading, allowing for a more comprehensive market analysis and potentially higher returns.
Quantitative trading offers two practical benefits. First, it uncovers hidden patterns in the market, providing traders with valuable insights. Secondly, and perhaps more importantly, it removes the emotional factor from trading decision-making, ensuring a more objective and reliable strategy in the long run.
How does Quantitative trading work?
The short answer is — through well-designed mathematical models.
Quant traders employ computer models to automate trading and make it more efficient. To make a functional mathematical model, one needs historical data and much of it. It helps traders examine, interpret, and predict the asset's behaviour on the market.
Imagine that you have a computer model that generates sell/buy signals based on the technical analysis of the currency exchange rate in real-time. You use this model to create an automated trading platform. Or you can take it a step further and use machine learning to teach the model how to study and analyse the influence of inflation, interest, GDP rates, and other macroeconomic factors on currency exchange rates.
These are just a couple of the exciting opportunities that Quantitative trading provides. By following specific steps to create and use a trading system, traders can tap into the potential of this strategy to enhance their trading outcomes.
How to create a Quantitative trading system
Building a Quantitative trading system includes four major phases or components. We will briefly describe each one.
Finding a trading idea
First things first, you need to identify a trading opportunity. This can be a specific correlation between the currencies, an economic trend, or even an abnormality you can capitalise on.
Serious research is needed to generate an idea like that and gather data for the mathematical model. This initial idea will be the general assumption upon which the trading algorithm will be built. It will determine both the trading strategy and frequency.
Backtesting
Like any other trading idea, this one needs to be tested. Backtesting is usually done through historical comparison: you gather the numbers that reflect the market situation within a specific timeframe and then enforce different economic and/or political scenarios to simulate the trading strategy's performance.
If historical numbers support your general assumption, the trading idea is viable. Backtesting would also allow you to optimise the model's parameters for maximum efficiency and adjust for risks.
Execution
Once the backtesting stage is completed, you can develop the trading execution system. Ideally, it would help if you aimed at creating an automated process per one trade, integrating brokerage into the interface while also minimising transactional costs.
Trading automation allows you to do more research and hold transactions more frequently.
Risk management
Risk management is important in quantitative trading. Traders utilise various tools to manage risk, including stop-loss orders, portfolio diversification, and hedging strategies. By performing Stress testing and backtesting, the trader gauges the severity of the strategy under various market conditions.
- Portfolio diversification
Portfolio diversification involves spreading investments across different asset classes. By diversification, traders mitigate risks linked with market volatility. One advantage of portfolio diversification is that it helps traders reduce the impact of adverse movements on any one asset.
- Capital allocation
One effective risk management strategy requires investors to determine the capital allocation for each trade to balance risk and reward. Traders use risk parity and value-at-risk (VaR) models to optimise capital allocation.
Quantitative trading strategies
Now that we've figured out how it works let's delve into the strategies that can be used for Quantitative trading.
Mean Reversion
In a mean reversion strategy, traders believe that prices will always revert to historical averages. Therefore, the extremes are just temporary. Thus, traders identify securities that have deviated away from the mean and forecast their return to mean value.
A score measures the price deviation from its statistical mean. When that score is high, it signals price reversal. That is how the model tells you when to go long or short and suggests optimal entry and exit points.
Traders use Statistical Indicators such as Bollinger Bands and moving averages to identify mean reversion opportunities. They are crucial in identifying overbought and oversold markets.
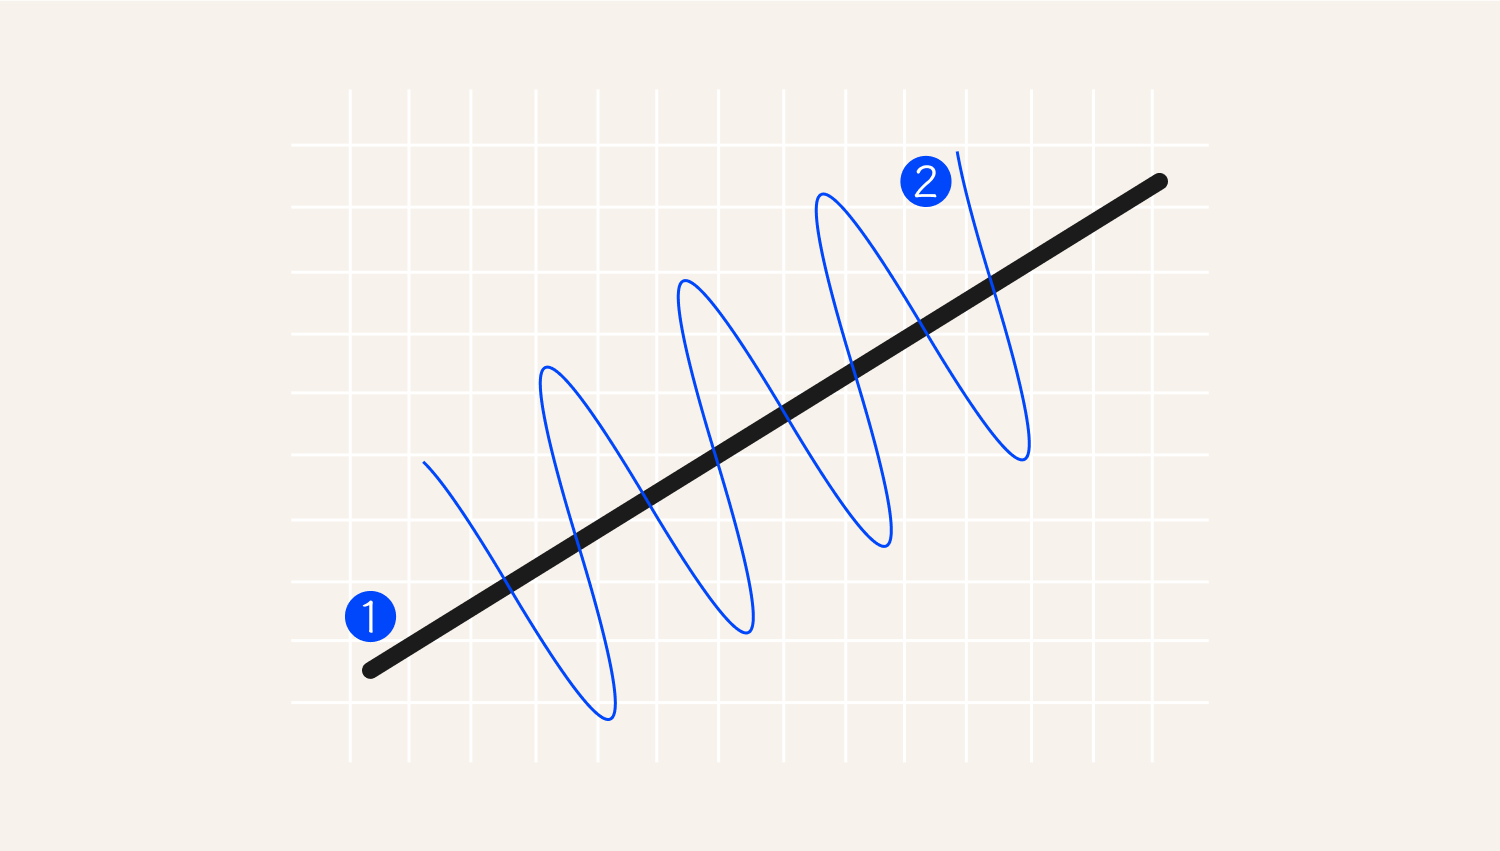
1. Statistical mean
2. Price level
As seen above, the price tends to oscillate around the historical mean.
Trend following
This approach uses a model created to profit from riding an established market trend. Traders calculate using Indicators like moving averages and price level movements. The key idea behind this strategy is that a trend can be upward (bullish), downward (bearish), or sideways. Trend followers seek to identify these movements and align their trades accordingly.
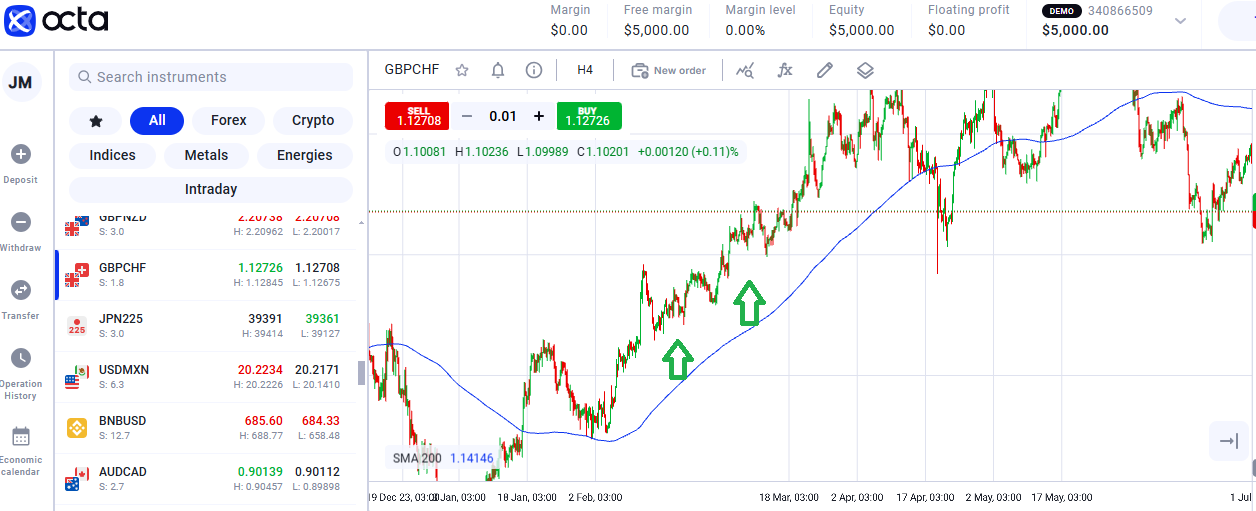
Bullish market—the price is rallying above the moving average.
Statistical arbitrage
Statistical arbitrage is a methodology that involves traders identifying market inefficiencies. Traders identify the inefficiencies between correlated assets, exploit these inefficiencies, and make a return. The methodology solely relies on the complex statistical models that detect mispricing in the market. Statistical arbitrage includes:
- Pairs trading is one of the standard methods of statistical arbitrage. It involves traders going long and short in a correlated asset. By doing so, the traders make returns from the relative price movements. Pairs trading demands a high degree of statistical modelling and real-time data analysis.
- Computational requirements. The strategy demands significant computational power and access to large datasets. The methodology is popular among hedge funds and big institutional traders. In this strategy, traders use high-frequency trading (HFT) systems to detect arbitrage opportunities.
Algorithmic pattern recognition
Traders use this method to uncover large trades made by more prominent companies. The latter typically try to disguise their transactions to avoid influencing the prices. They do so by dispersing their trades over multiple exchanges or between brokers. A model can help you recognise such patterns and play before another significant transaction fuels the price.
ETF rule
Exchange-traded funds typically track indices. The ETF Trading Rule suggests you can profit from observing the relationship between the currency ETFs and the index they track if you can recognise the pattern. In this case, an ultra-fast execution system can help you predict the price movement.
Example
Let's assume that there is a price discrepancy in a currency pair that will be somewhat corrected in the future. What should you do once you notice this difference? Guided by the statistical arbitrage trading strategy, you would create two sets of currency pairs—an underperforming and an overperforming one. Once you've done that, you would short the overperforming currency pair while simultaneously buying the underperforming one.
Pros and cons of Quant trading
Quantitative trading offers investors a plethora of benefits:
- A systematic approach to trading decisions based on data and statistics rather than a hunch reduces the chance of human error.
- Clocking patterns that an ordinary person might need to catch up on.
- Trading process automation leads to an increase in efficiency.
- Real-time parameter optimisation for better risk management.
- The incorporation of multiple variables helps to get a more reliable prognosis.
However, technological advancements also come with drawbacks:
- The quality of historical data used for the model can heavily impact the outcome.
- Excessive complexity can cause the model to capture data noise rather than underlying patterns.
- Overfitting can occur, in which the model works exceptionally well with historical data but fails to adjust to unseen data.
- A lack of qualitative analysis can create an incomplete picture and cause misleading interpretations.
Final thoughts
- Quantitative trading is a powerful tool for traders to master. It helps them make informed trading decisions and navigate the complexity of the global financial market.
- By employing mathematical models, investors can uncover hidden trading opportunities they would not have noticed otherwise.
- Trade automation can free up your time to focus more on research and increase trading frequency, making it more efficient.
- The ability of computers to process more variables can help with adjusting to changes and managing risks better.
- While they all have drawbacks, implementing one of Quant's trading strategies can help you play proactively and better understand the market.
