


The Bullish Harami pattern meaning
What is the Bullish Harami Cross?
How is the Bullish Harami candlestick structured?
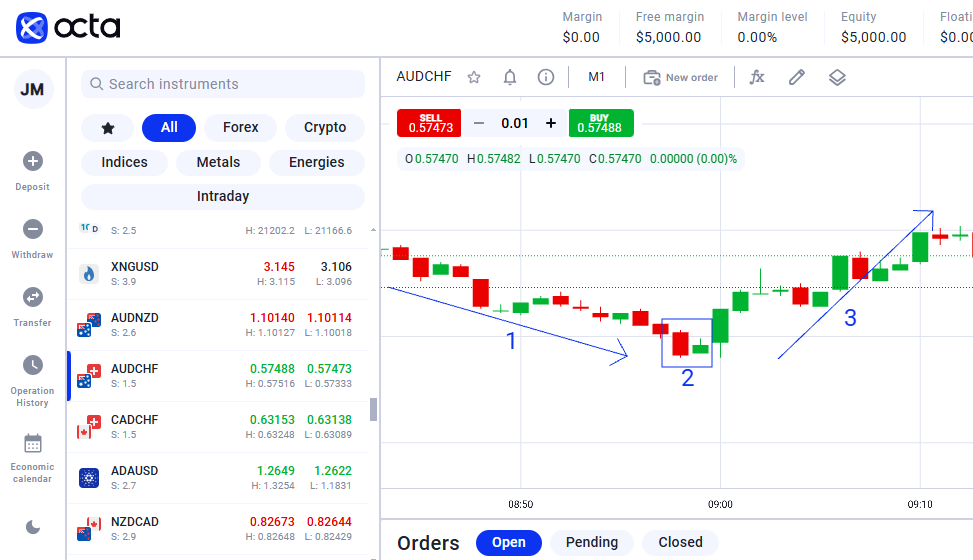
How to spot the Bullish Harami pattern on a chart
How to trade the Bullish Harami candlestick pattern
The Japanese started using technical analysis to trade rice in the 17th century. Although this form of technical analysis differed from the U.S. version introduced by Charles Dow around 1900, many fundamental principles were quite similar.
In the 18th century, a Japanese rice trader named Munehisa Honma studied how rice prices changed due to supply, demand, and traders' emotions. He developed candlestick charts to visually show price movements, using different colours to highlight price rises and declines. Over time, these candles evolved and are now commonly used in trading. Today, traders rely on candlestick charts to identify patterns that help them make informed decisions about market direction.
One important candlestick pattern is the Bullish Harami. In this article, we will analyse the key distinctive features of this pattern, examine its components, learn how to differentiate it from similar patterns and explore how to maximise its effectiveness in trading.
The Bullish Harami pattern meaning
The Bullish Harami is a two-candle pattern that forms at the end of a downtrend. It signals a potential change in trend. The first candle is a large bearish one, followed by a smaller bullish candle entirely within the range of the first. The term 'harami' means 'pregnant' in Japanese. This word signifies how the smaller candle is contained within the larger one.
The candlestick pattern develops over two candlesticks—over two days on a daily chart or over two hours on a 1-hour chart—and indicates decreasing bearish pressure. It suggests that buyers may gain strength and start pushing prices up. Traders often interpret the Bullish Harami as a buy signal.
The counterpart of the Bullish Harami after the bullish uptrend consists of a bullish candle followed by a larger bearish candle, indicating that prices may decline. Understanding the visual differences between these two patterns is essential to read the graphs correctly.
What is the Bullish Harami Cross?
The Bullish Harami Cross is similar to the Bullish Harami candlestick. Instead of a small bullish candle, it features a Doji (a candle where the opening and closing prices are very close), suggesting even more substantial uncertainty and potential for a price reversal.
How is the Bullish Harami candlestick structured?
Let's examine each candlestick of the pattern in detail so you can identify it visually. In Bullish Harami, we focus on the candles' size, their positioning relative to one another, and their colours.
The first candle of the pattern is bearish, indicating continued downward momentum. The second candle opens higher than the first candle's close and closes within its body. The low of the bearish candle is lower than the low of the smaller bullish candle, while the high of the bearish candle is higher than that of the bullish candle. The second candle is typically about 25% the size of the first.
Candle colours matter in the Bullish Harami. The bearish candle is usually shaded, often red, indicating selling pressure. The bullish candle, frequently green, represents buying pressure. This colour difference helps traders identify the likelihood of a price reversal.
Steps to identify the Bullish Harami:
- Identify the trend—it should be bearish.
- Spot the Bullish Harami—two candles, the bearish and the smaller bullish one following it.
- Confirm the reversal at the start of a bullish trend.
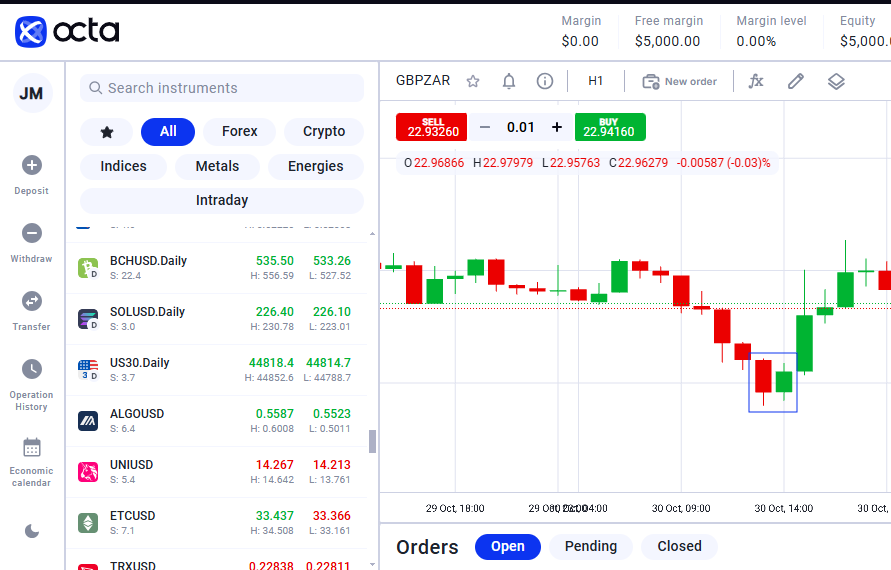
How to spot the Bullish Harami pattern on a chart
To find a Bullish Harami candlestick on a trading chart, follow the steps below:
- Start by checking for a downtrend, where prices have been falling.
- Look for signs that this decline might be slowing or reversing. You can use tools like stochastic oscillators or look for a bullish moving average crossover.
- Ensure that the small bullish candle is no larger than 25% of the size of the previous bearish candle and is positioned right next to it. This bullish candle must be completely contained within the body of the last bearish candle.
- Finally, get more confidence in the Bullish Harami by looking for additional indicators or support levels that back up what you see on the chart.
Examples
Let's explore how this pattern can emerge using examples from various currency pairs below.
- EURUSD
Imagine you're analysing the EURUSD currency pair on a trading chart. One day, the price opens at 1.1000 and closes at 1.0900, creating a long bearish candlestick, indicating a significant price drop. The next day, the price opens at 1.0890. It closes at 1.0910, forming a smaller bullish candlestick that remains within the body of the previous day's candle representing the Harami pattern. The long, bearish candle shows that sellers were in control. In contrast, the smaller, bullish candle suggests buyers are beginning to enter. As a trader, you might interpret this as a buy signal, expecting the price to rise from 1.0910 back to levels like 1.0950 or even higher.
- GBPJPY
Now, let's consider GBPJPY. On one trading day, the price starts at 150.00 and drops to close at 148.50, forming a long bearish candle. The following day, the price opens at 148.40 and closes at 148.70, creating a smaller bullish candle that fits entirely within the range of the previous day's candle. This serves as another example of the Bullish Harami pattern. The significant drop indicates strong selling pressure, while the smaller rise shows buyers are beginning to enter the market. If you were trading this pair, you might think about buying at 148.70, anticipating that the price could rise toward levels like 149.00 or higher as buying momentum builds.
How to trade the Bullish Harami candlestick pattern
To effectively trade the Bullish Harami candlestick pattern, follow the steps below.
First, identify the Bullish Harami pattern at the end of a downward trend, signalling a potential reversal. Once you see this pattern, it's critical to confirm the trend reversal by using another momentum or oscillator indicator, such as MACD, RSI, or Stochastic, to ensure that a change in price direction is likely.
After confirming the pattern, wait for the next candle following the Bullish Harami to close above the highest price of the previous bearish candle. This closing price signals that an upward trend may be commencing. When this occurs, you can enter a long position. Still, it's wise to set a stop-loss order just below the lowest level of the bearish candle within the Harami pattern to manage your risk if the market moves against you.
Identifying the Bullish Harami pattern is relatively straightforward. Still, it's crucial to combine it with other indicators to strengthen your trading decision. For example, using MACD and RSI can provide additional confirmation of the trend reversal. Incorporating Fibonacci retracements can help you identify critical support and resistance levels.
Final thoughts
- The Bullish Harami candlestick is a signal in Forex trading that indicates a potential reversal from a downtrend to an uptrend.
- Bullish Harami is a pattern of two candlesticks in which the second bullish candlestick is contained within the first bearish one.
- If you circle these two candlesticks, the first one will visually capture the second one; from this comes its name, Harami, meaning 'pregnant' in Japanese.
- You can spot this pattern on a price chart when you see a large red (bearish) candle immediately followed by a smaller green (buliish) candle.
- When this pattern occurs while trading, it's generally seen as a buy signal, especially if other indicators support a potential upward move.
