Confirming you are not from the U.S. or the Philippines

By giving this statement, I explicitly declare and confirm that:
  • I am not a U.S. citizen or resident
  • I am not a resident of the Philippines
  • I do not directly or indirectly own more than 10% of shares/voting rights/interest of the U.S. residents and/or do not control U.S. citizens or residents by other means
  • I am not under the direct or indirect ownership of more than 10% of shares/voting rights/interest and/or under the control of U.S. citizen or resident exercised by other means
  • I am not affiliated with U.S. citizens or residents in terms of Section 1504(a) of FATCA
  • I am aware of my liability for making a false declaration.
For the purposes of this statement, all U.S. dependent countries and territories are equalled to the main territory of the USA. I accept full responsibility for the accuracy of this declaration and commit to personally address and resolve any claims or issues that may arise from a breach of this statement.
We are dedicated to your privacy and the security of your personal information. We only collect emails to provide special offers and important information about our products and services. By submitting your email address, you agree to receive such letters from us. If you want to unsubscribe or have any questions or concerns, write to our Customer Support.
Octa trading broker
Open trading account
Back

AUD/JPY Price Analysis: Cross enters in consolidation phase, downturn likely momentary

  • Daily chart indicators suggest correction phase sets in; RSI drops signifying easing of overbought conditions.
  • Hourly chart indicators remain in negative territory, signaling downside correction in the near term.
  • Bulls show signs of exhaustion, unable to retest 105.00 highs.

In Wednesday's session, the AUD/JPY pair displayed signs of correction, retreating to the 104.30 mark following an earlier surge to 104.90. Seemingly, buyers are finding it tough to maintain upward traction. The market appears to have started a short-term correction phase.

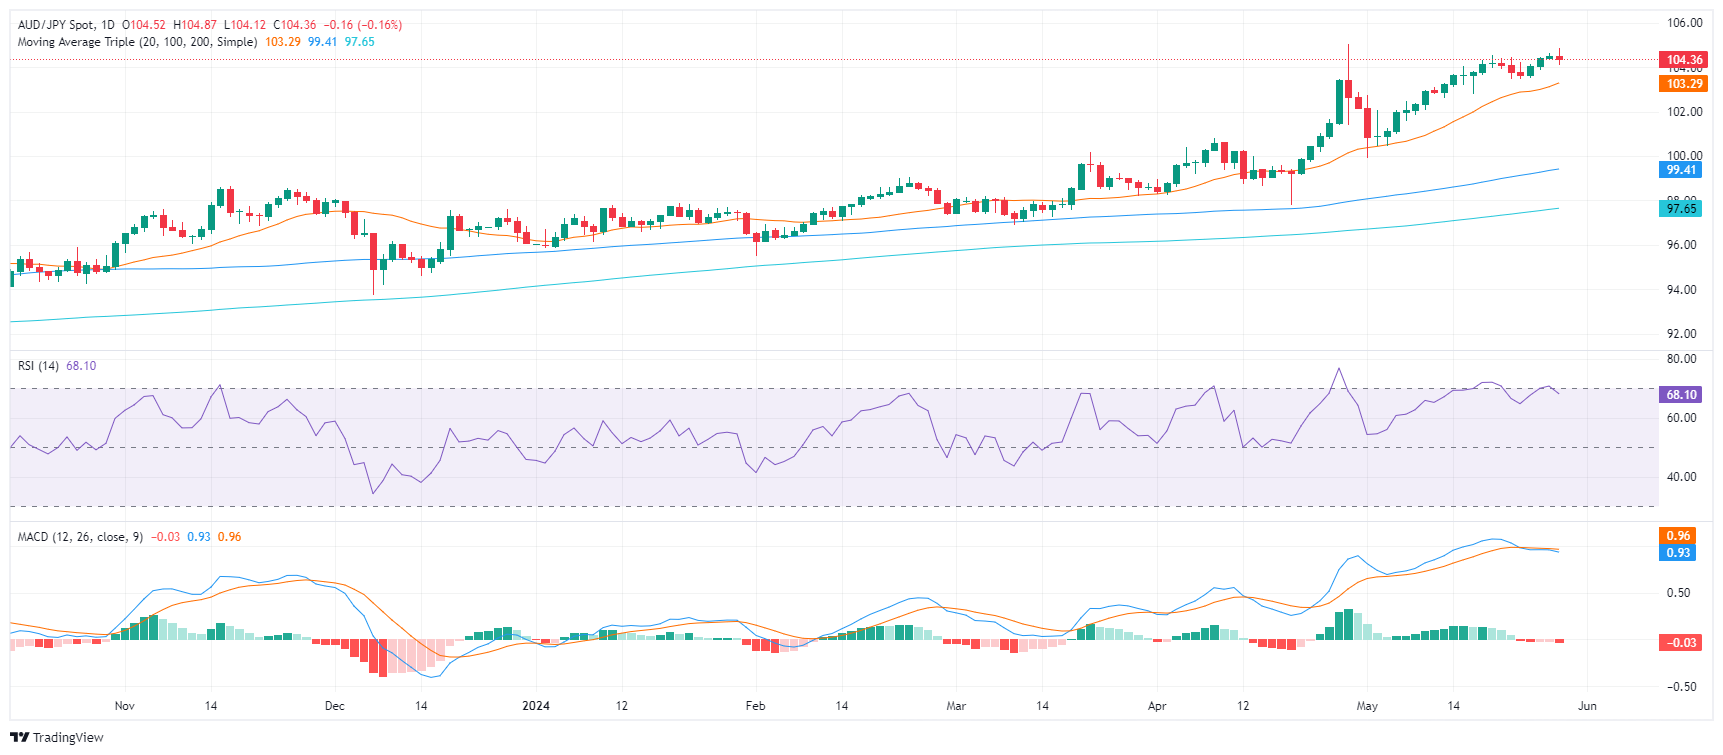
On the daily chart, the RSI has edged down to 67 territory, indicating easing of earlier overbought conditions. In sync with this, MACD continues to print red bars, further solidifying the possibility of weakening buying power.

AUD/JPY daily chart
Reiterating these sentiments is the hourly chart. The RSI and MACD both remain in negative territory, indicating a probable near-term correction.

AUD/JPY hourly chart
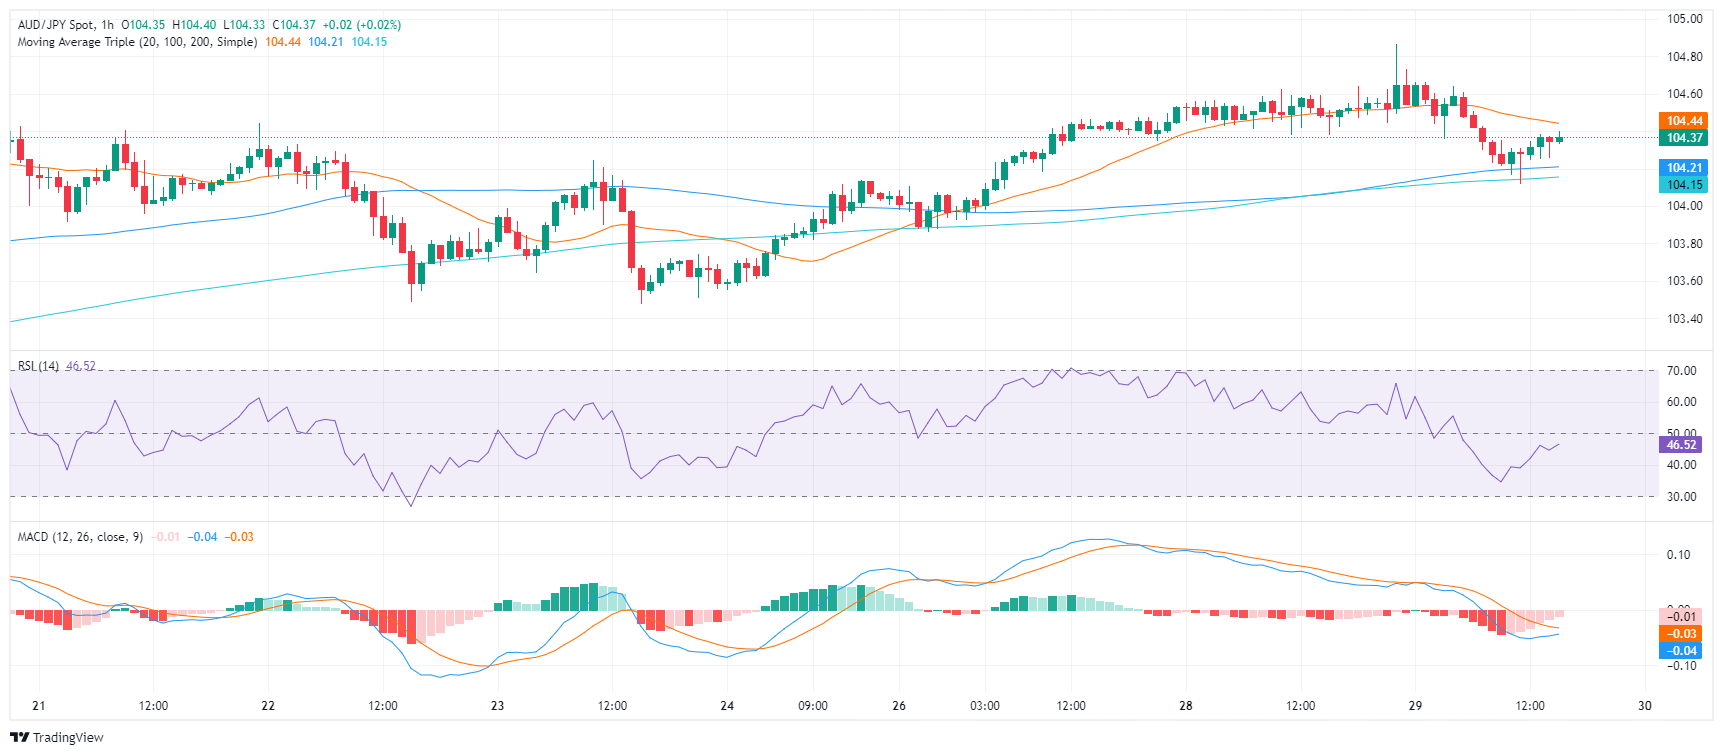
The prominent resistance remains the cycle high just above 105.00 while the 20-day SMA, now at 103.29, continues to provide strong support.


AUD/JPY

Overview
Today last price 104.38
Today Daily Change -0.14
Today Daily Change % -0.13
Today daily open 104.52
 
Trends
Daily SMA20 103.12
Daily SMA50 101.15
Daily SMA100 99.35
Daily SMA200 97.59
 
Levels
Previous Daily High 104.62
Previous Daily Low 104.35
Previous Weekly High 104.56
Previous Weekly Low 103.48
Previous Monthly High 105.04
Previous Monthly Low 97.78
Daily Fibonacci 38.2% 104.52
Daily Fibonacci 61.8% 104.45
Daily Pivot Point S1 104.37
Daily Pivot Point S2 104.22
Daily Pivot Point S3 104.1
Daily Pivot Point R1 104.65
Daily Pivot Point R2 104.78
Daily Pivot Point R3 104.93


Dow Jones Industrial Average tumbles almost 400 points on Wednesday

The Dow Jones Industrial Average (DJIA) is broadly lower on Wednesday, shedding nearly 400 points and backsliding into 38,500.00.
Read more Previous

Gold price tumbles on Wednesday as rising US yields boost Greenback

Gold prices slump on Wednesday amid rising US Treasury yields, boosting demand for the Greenback due to hawkish comments by a Federal Reserve (Fed) official.
Read more Next