Confirming you are not from the U.S. or the Philippines

By giving this statement, I explicitly declare and confirm that:
  • I am not a U.S. citizen or resident
  • I am not a resident of the Philippines
  • I do not directly or indirectly own more than 10% of shares/voting rights/interest of the U.S. residents and/or do not control U.S. citizens or residents by other means
  • I am not under the direct or indirect ownership of more than 10% of shares/voting rights/interest and/or under the control of U.S. citizen or resident exercised by other means
  • I am not affiliated with U.S. citizens or residents in terms of Section 1504(a) of FATCA
  • I am aware of my liability for making a false declaration.
For the purposes of this statement, all U.S. dependent countries and territories are equalled to the main territory of the USA. I accept full responsibility for the accuracy of this declaration and commit to personally address and resolve any claims or issues that may arise from a breach of this statement.
We are dedicated to your privacy and the security of your personal information. We only collect emails to provide special offers and important information about our products and services. By submitting your email address, you agree to receive such letters from us. If you want to unsubscribe or have any questions or concerns, write to our Customer Support.
Octa trading broker
Open trading account
Back

EUR/JPY Price Analysis: Bears assert their dominance, push the pair the below 20-day SMA

  • The daily RSI has continued on its downward trajectory, backed by the rising red bards on the MACD.
  • Previously strong support at 20-day SMA has been breached, opening the potential for further bearish movements in the short term.
  • The existing bullish trend finds defense in the 100 and 200-day SMAs, around the 164.00 and 161.00 levels respectively.

In Tuesday's session, the EUR/JPY pair endured significant selling pressure pushing below the cross below the strong support level of the 20-day Simple Moving Average (SMA) at 169.30, and touching a low of 168.50. Although this bearish movement puts a dampener on the outlook over the short term, the overall bullish outlook remains unaffected.

This shift in momentum aligns with the downward turn noted in the daily Relative Strength Index (RSI), which now stands at 46, compared to the higher reading of 61 in Monday's session. This indicates a loss in buying momentum, echoed by the daily Moving Average Convergence Divergence (MACD) which exhibits increasing red bars.

EUR/JPY daily chart

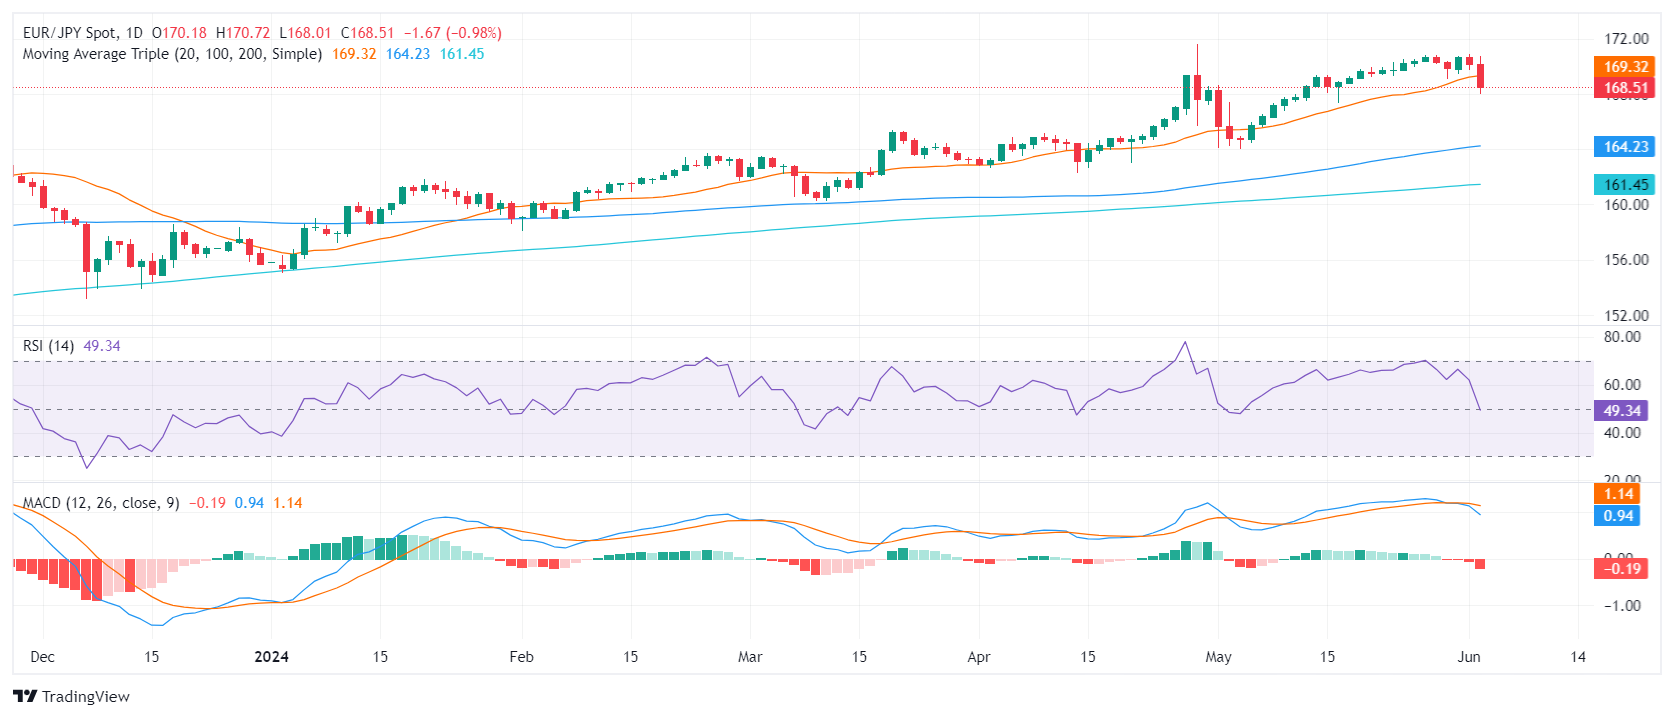
Looking at the broader picture, despite the short-term bearishness, the lengthy bullish trend remains unaffected for the moment. The support given by the 100 and 200-day Simple Moving Averages (SMAs) at 164.00 and 161.00 respectively will need to be broken in order to flip the table. Conversely, for the bulls to regain momentum, they will need to recapture the 169.30 region, which recently turned from support to resistance.

EUR/JPY

Overview
Today last price 168.54
Today Daily Change -1.64
Today Daily Change % -0.96
Today daily open 170.18
 
Trends
Daily SMA20 169.21
Daily SMA50 166.63
Daily SMA100 164.15
Daily SMA200 161.41
 
Levels
Previous Daily High 170.89
Previous Daily Low 169.72
Previous Weekly High 170.8
Previous Weekly Low 169.07
Previous Monthly High 170.8
Previous Monthly Low 164.02
Daily Fibonacci 38.2% 170.17
Daily Fibonacci 61.8% 170.44
Daily Pivot Point S1 169.64
Daily Pivot Point S2 169.09
Daily Pivot Point S3 168.46
Daily Pivot Point R1 170.81
Daily Pivot Point R2 171.44
Daily Pivot Point R3 171.98


United States API Weekly Crude Oil Stock came in at 4.052M, above expectations (-1.9M) in May 31

United States API Weekly Crude Oil Stock came in at 4.052M, above expectations (-1.9M) in May 31
Read more Previous

GBP/USD trades below 1.2800 after safe haven flows bolster Greenback

GBP/USD shed a third of a percent through Tuesday’s trading, falling below 1.2800 after short-lived bullish momentum carried the pair into its highest bids since mid-March.
Read more Next