USD/CAD Price Forecast: Hovers around 1.4150 after pulling back from multi-year highs
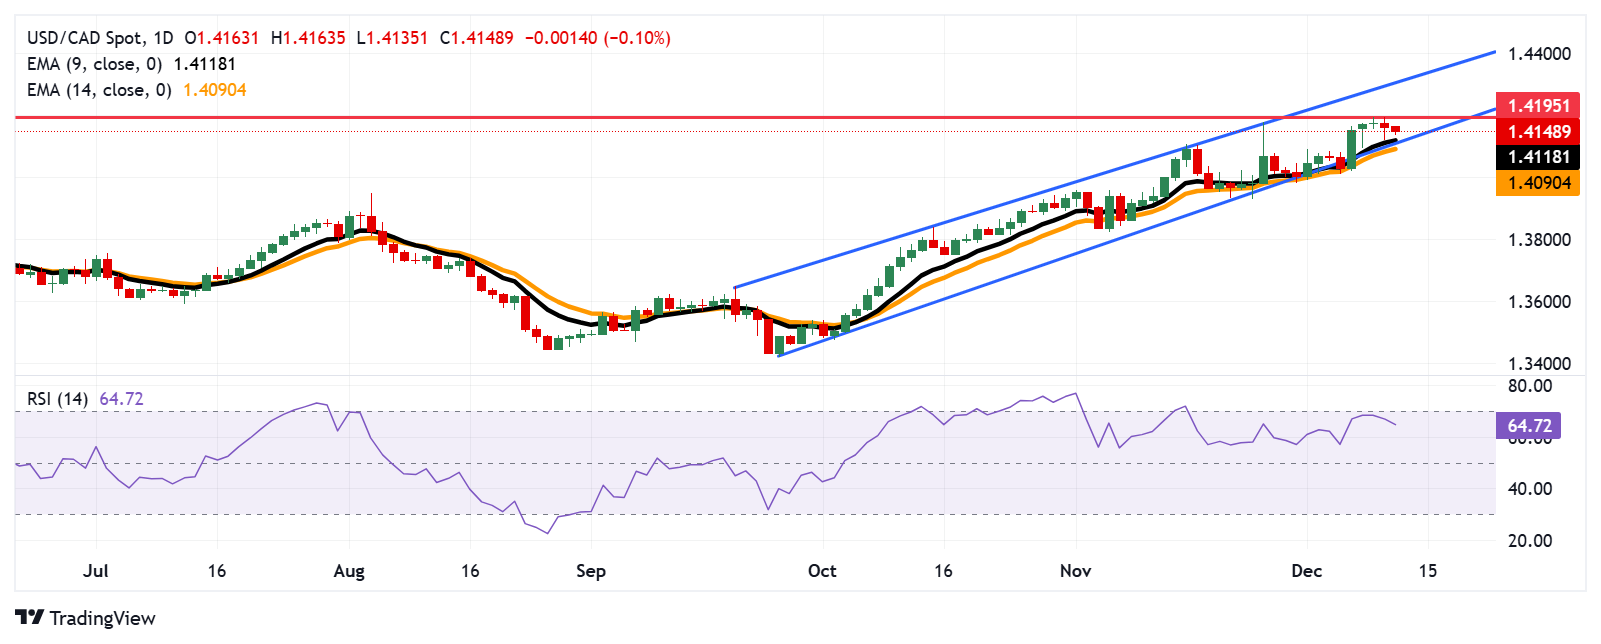
- USD/CAD could potentially retest 1.4195, the highest level since April 2020.
- The bullish sentiment could be strengthened if the RSI remains near the 70 level.
- The pair could find initial support at the nine-day EMA of 1.4118 level, aligned with the ascending channel’s lower boundary.
USD/CAD remains tepid for the second successive day, trading around 1.4150 during the European session on Thursday. From a technical perspective, the daily chart analysis shows the Loonie pair trends higher within an ascending channel pattern, suggesting a strengthening bullish bias.
The 14-day Relative Strength Index (RSI) has retreated from the near 70 mark, suggesting a potential downward correction. However, if the RSI maintains its position near the 70 level, it would strengthen the bullish sentiment.
Additionally, the USD/CAD pair remains above the nine- and 14-day Exponential Moving Averages (EMA), signaling a bullish outlook and indicating strengthening short-term price momentum. This suggests strong buying interest and the potential for further price gains.
On the upside, the USD/CAD pair may retest the region around its recent high of 1.4195, a level last seen in April 2020. A successful break above this level could strengthen the bullish bias and lead the pair to test the upper boundary of the ascending channel at a psychological level of 1.4300.
Regarding support, the USD/CAD pair could first test the nine-day EMA at the 1.4118 level, which aligns with the lower boundary of the ascending channel. The 14-day EMA at 1.4090 could also provide additional support. A break below this region could weaken the bullish sentiment and push the pair toward the psychological level of 1.4000.
USD/CAD: Daily Chart
Canadian Dollar PRICE Today
The table below shows the percentage change of Canadian Dollar (CAD) against listed major currencies today. Canadian Dollar was the strongest against the Swiss Franc.
| USD | EUR | GBP | JPY | CAD | AUD | NZD | CHF | |
|---|---|---|---|---|---|---|---|---|
| USD | -0.13% | -0.10% | 0.05% | -0.09% | -0.59% | -0.27% | 0.47% | |
| EUR | 0.13% | 0.03% | 0.10% | 0.05% | -0.46% | -0.14% | 0.60% | |
| GBP | 0.10% | -0.03% | 0.10% | 0.01% | -0.49% | -0.17% | 0.57% | |
| JPY | -0.05% | -0.10% | -0.10% | -0.08% | -0.57% | -0.28% | 0.49% | |
| CAD | 0.09% | -0.05% | -0.01% | 0.08% | -0.49% | -0.18% | 0.55% | |
| AUD | 0.59% | 0.46% | 0.49% | 0.57% | 0.49% | 0.32% | 1.06% | |
| NZD | 0.27% | 0.14% | 0.17% | 0.28% | 0.18% | -0.32% | 0.74% | |
| CHF | -0.47% | -0.60% | -0.57% | -0.49% | -0.55% | -1.06% | -0.74% |
The heat map shows percentage changes of major currencies against each other. The base currency is picked from the left column, while the quote currency is picked from the top row. For example, if you pick the Canadian Dollar from the left column and move along the horizontal line to the US Dollar, the percentage change displayed in the box will represent CAD (base)/USD (quote).

