Confirming you are not from the U.S. or the Philippines

By giving this statement, I explicitly declare and confirm that:
  • I am not a U.S. citizen or resident
  • I am not a resident of the Philippines
  • I do not directly or indirectly own more than 10% of shares/voting rights/interest of the U.S. residents and/or do not control U.S. citizens or residents by other means
  • I am not under the direct or indirect ownership of more than 10% of shares/voting rights/interest and/or under the control of U.S. citizen or resident exercised by other means
  • I am not affiliated with U.S. citizens or residents in terms of Section 1504(a) of FATCA
  • I am aware of my liability for making a false declaration.
For the purposes of this statement, all U.S. dependent countries and territories are equalled to the main territory of the USA. I accept full responsibility for the accuracy of this declaration and commit to personally address and resolve any claims or issues that may arise from a breach of this statement.
We are dedicated to your privacy and the security of your personal information. We only collect emails to provide special offers and important information about our products and services. By submitting your email address, you agree to receive such letters from us. If you want to unsubscribe or have any questions or concerns, write to our Customer Support.
Back

NZD/USD Price Analysis: Kiwi slips as moving average cluster offers key support

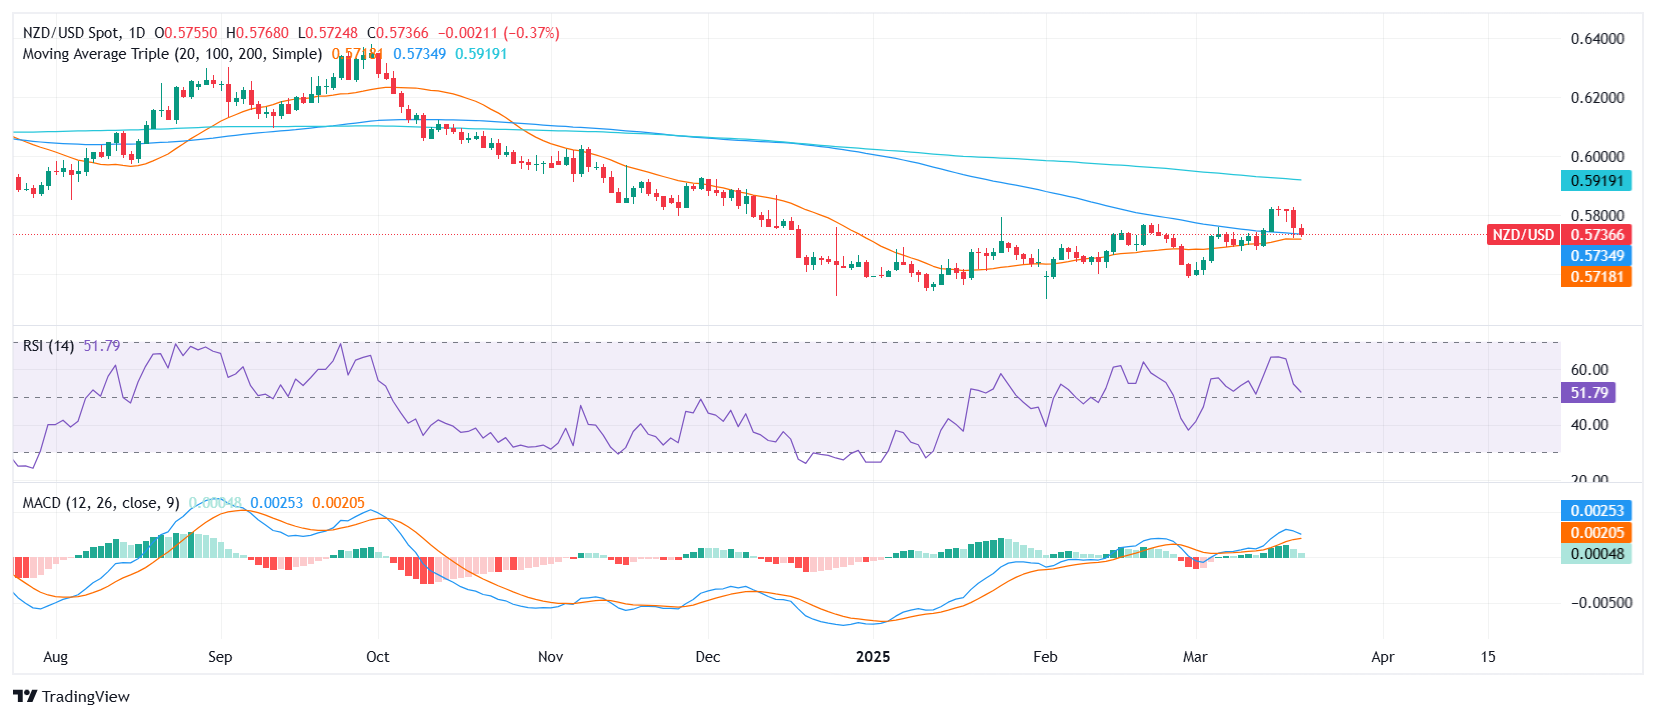
  • NZD/USD was seen around the 0.5730 zone, posting modest daily losses ahead of the Asian session.
  • The pair is testing a key confluence of the 20 and 100-day moving averages, with downside risks emerging below this area.

During Friday’s session ahead of the Asian open, NZD/USD declined modestly and was last seen hovering around the 0.5730 area. The pair remains under pressure after sellers stepped in earlier in the day, with price action now centered around the convergence of the 20-day and 100-day Simple Moving Averages—a key technical juncture for the short-term outlook.

The Relative Strength Index (RSI) has sharply dropped but still holds in the positive region, hovering just above the 50 mark, suggesting that bullish momentum is fading. The Moving Average Convergence Divergence (MACD) remains above zero, but its histogram is printing smaller green bars, reflecting weakening upside pressure.

Technically, a clean break below the 0.5730 support area—where the 20-day and 100-day SMAs intersect—could expose the pair to a deeper pullback toward 0.5680 and then the 0.5620 zone. On the flip side, if buyers manage to defend this support cluster, recovery attempts could target resistance around 0.5780 and 0.5820 next.

NZD/USD daily chart
AUD/JPY Price Analysis: Aussie dips slightly as 20-day SMA offers support

On Friday’s session the AUD/JPY edged slightly lower and was seen trading in the 93.70 area.
Read more Previous

Banxico expected to cut rates to 9% – Reuters

A Reuters poll revealed that on March 27, Banco de Mexico (Banxico) is expected to cut interest rates by 50 bps amid the evolution of the disinflation process and an ongoing economic slowdown.
Read more Next