Confirming you are not from the U.S. or the Philippines

By giving this statement, I explicitly declare and confirm that:
  • I am not a U.S. citizen or resident
  • I am not a resident of the Philippines
  • I do not directly or indirectly own more than 10% of shares/voting rights/interest of the U.S. residents and/or do not control U.S. citizens or residents by other means
  • I am not under the direct or indirect ownership of more than 10% of shares/voting rights/interest and/or under the control of U.S. citizen or resident exercised by other means
  • I am not affiliated with U.S. citizens or residents in terms of Section 1504(a) of FATCA
  • I am aware of my liability for making a false declaration.
For the purposes of this statement, all U.S. dependent countries and territories are equalled to the main territory of the USA. I accept full responsibility for the accuracy of this declaration and commit to personally address and resolve any claims or issues that may arise from a breach of this statement.
We are dedicated to your privacy and the security of your personal information. We only collect emails to provide special offers and important information about our products and services. By submitting your email address, you agree to receive such letters from us. If you want to unsubscribe or have any questions or concerns, write to our Customer Support.
Octa trading broker
Open trading account
Back

AUD/JPY Price Analysis: Bears looking for monthly weekly and daily bearish confluence

  • AUD/JPY is an attractive short below the daily structure.
  • Currently, the stars do not quite align across all time frames from a top-down market structure analysis. 

The Monthly is bearish and is looking as though it wants to form a head and shoulders.

The weekly is proving that there is resistance that first needs to hold the bullish commitments at this juncture.

The daily chart has a strong bullish bias while holding above a strong support structure along with the ascending trendline support.
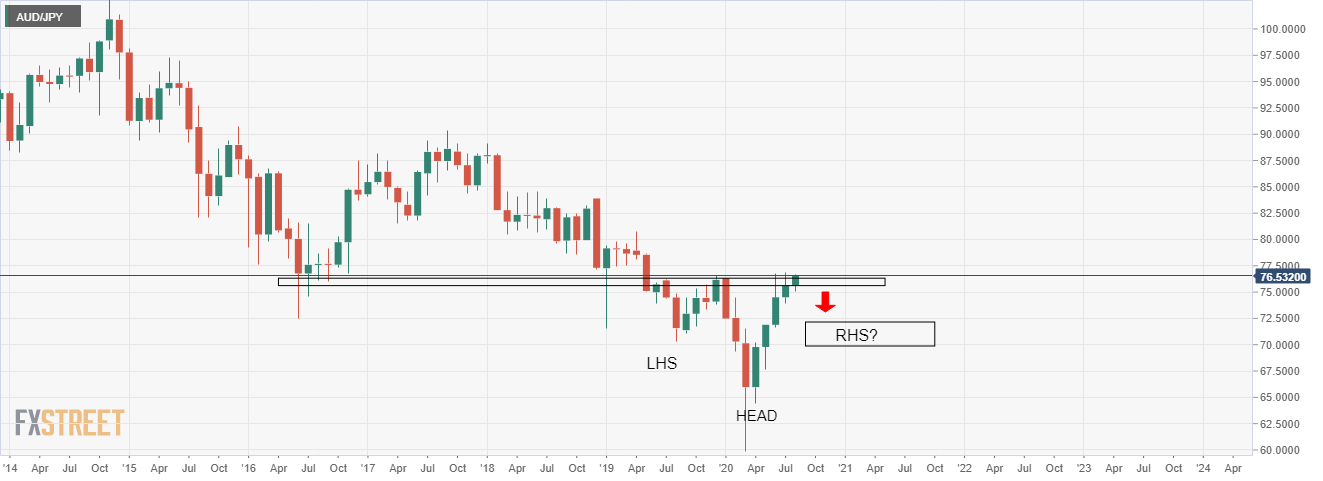
Monthly chart

The above chart shows a potential reversal head and shoulders pattern in the making, offering downside target opportunities for the bears. 

Weekly chart

The weekly chart is showing that the bulls are trying for a second attempt a the resistance. Should they fail, the prospects for the head and shoulders are sound.

Daily chart

The daily support structure is a confluence of higher lows, the support trendline and a restest of the structure which confirms a bullish bias.


However, should the same confluence breakdown, then bears will be looking to take over in the barroom brawl zone and a shorting opportunity on a retest of broken support structure turned resistance. 

When is the Australia unemployment rate and how could it affect AUD/USD?

July month employment statistics from the Australian Bureau of Statistics, up for publishing at 01:30 GMT on Thursday, will be the immediate catalyst
Read more Previous

EUR/USD Price Analysis: Falling wedge breakout suggests bull revival

EUR/USD is currently chipping away at the psychological hurdle of 1.18, having put in a low of 1.1711 on Wednesday. The 4-hour chart shows a falling w
Read more Next